The phase of a substance is a function of temperature, specific volume, and pressure. This is often expressed graphically with:
- Temperature-specific volume (-) diagrams
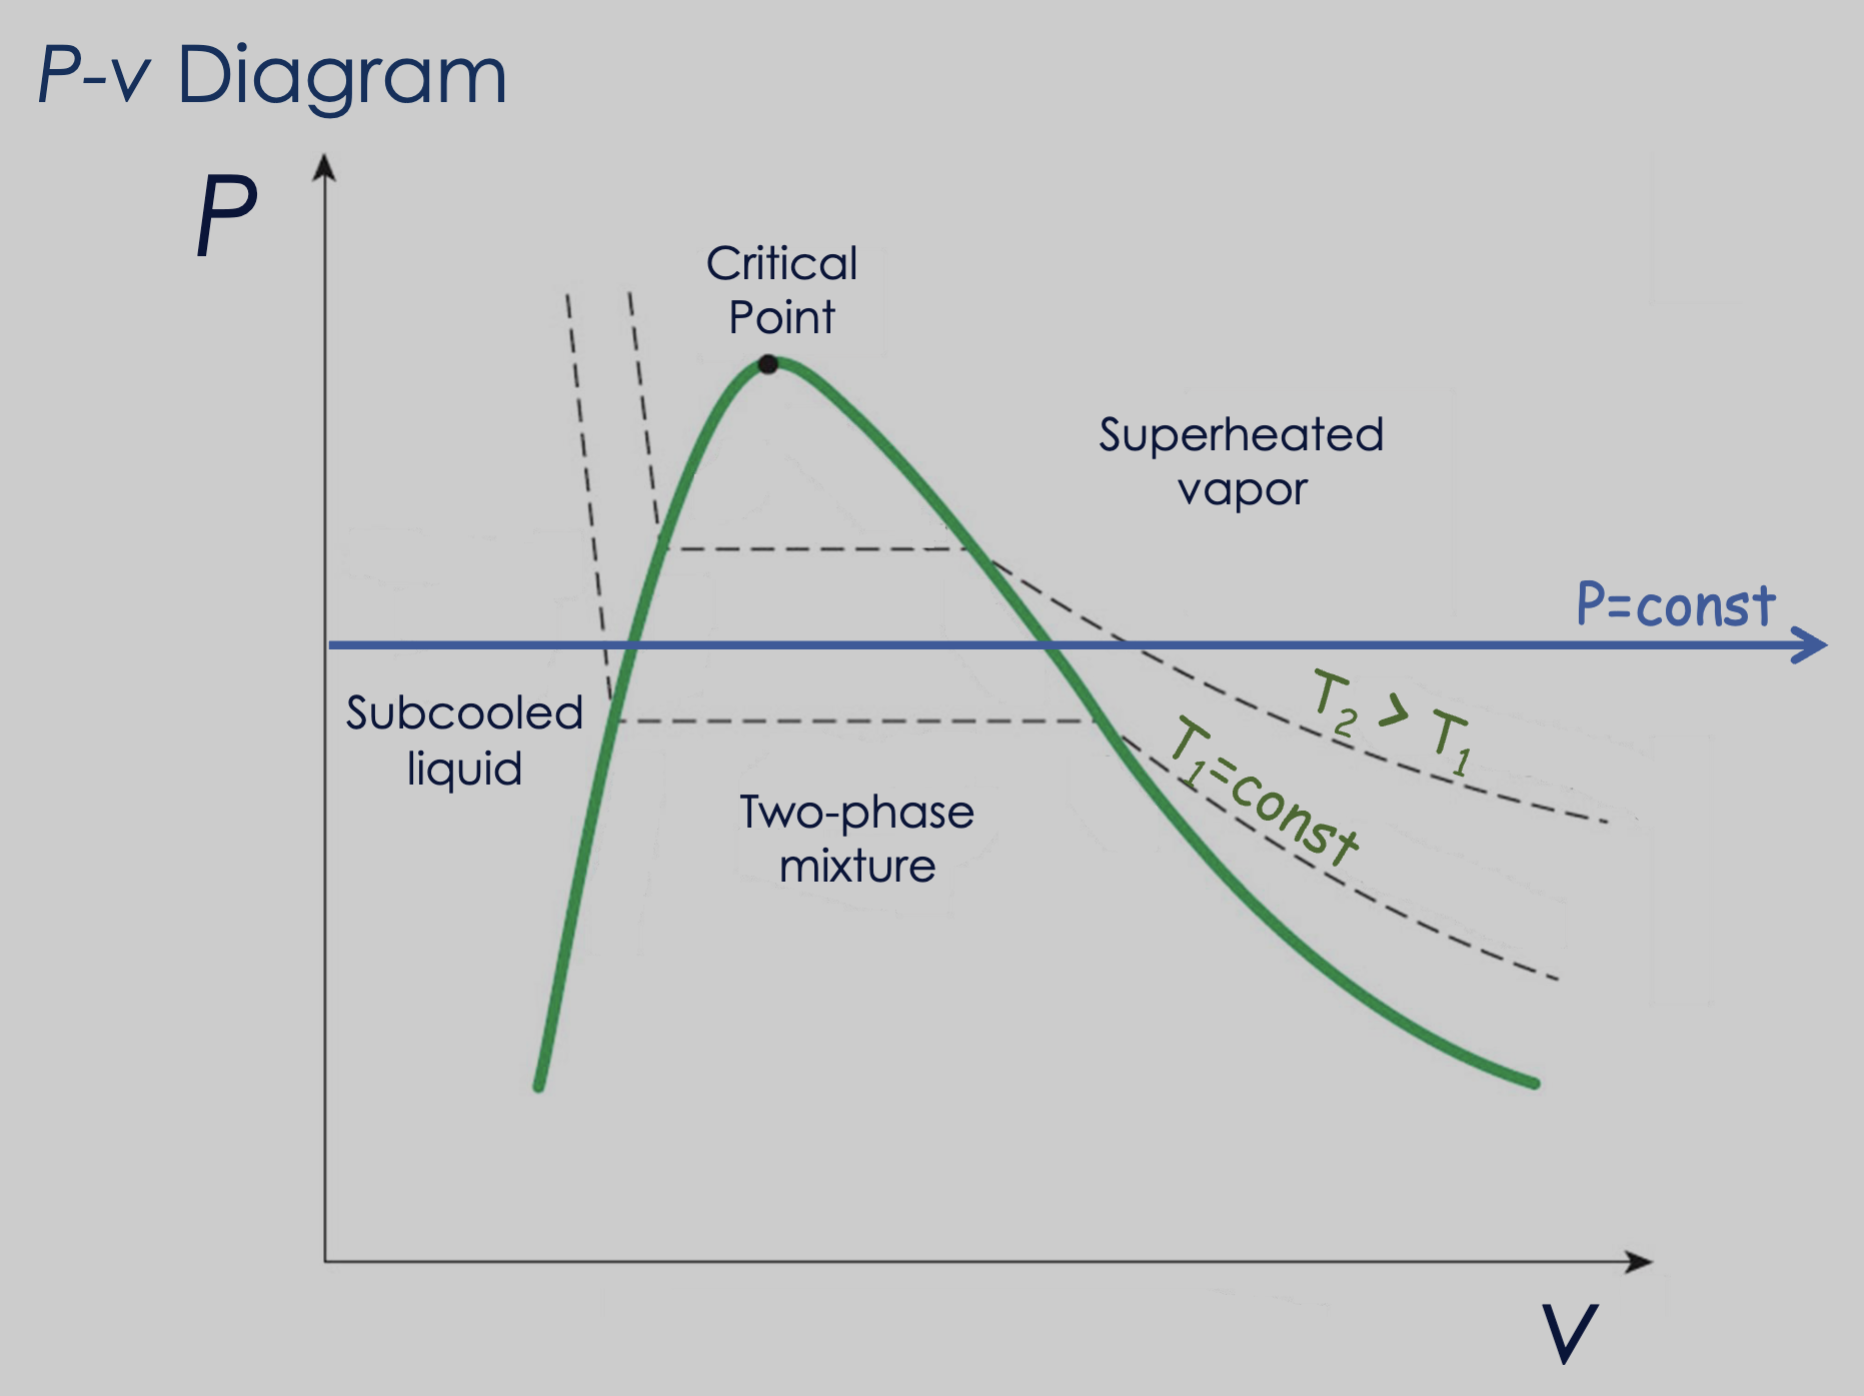
- Pressure-specific volume (-) diagrams
- Pressure-temperature (-) diagrams
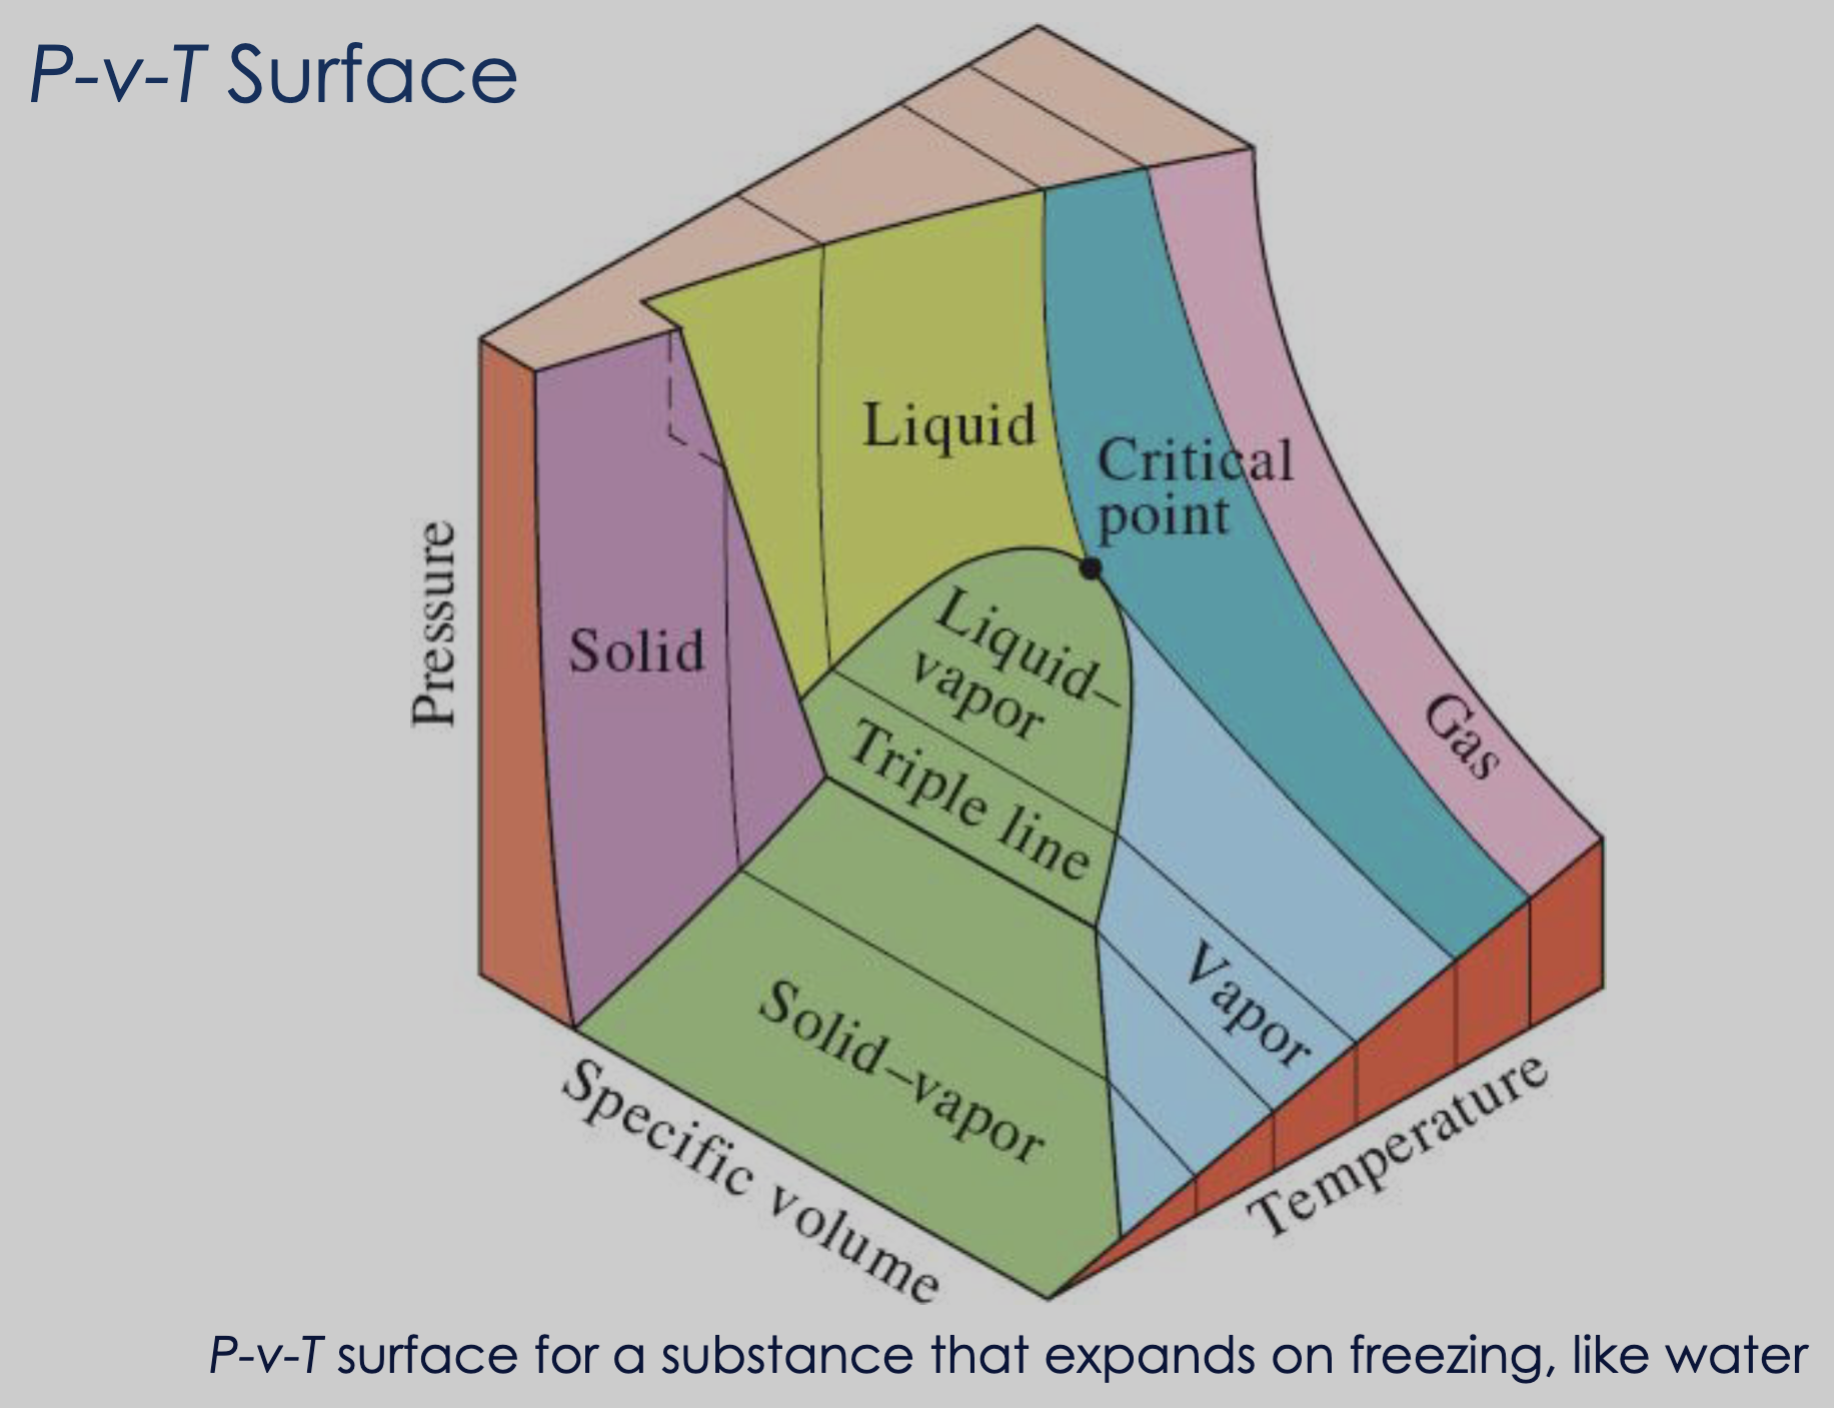
- Pressure-specific volume-temperature (--) surface
T-v Diagram
- The dotted lines on the T-v diagram represents lines of constant pressure
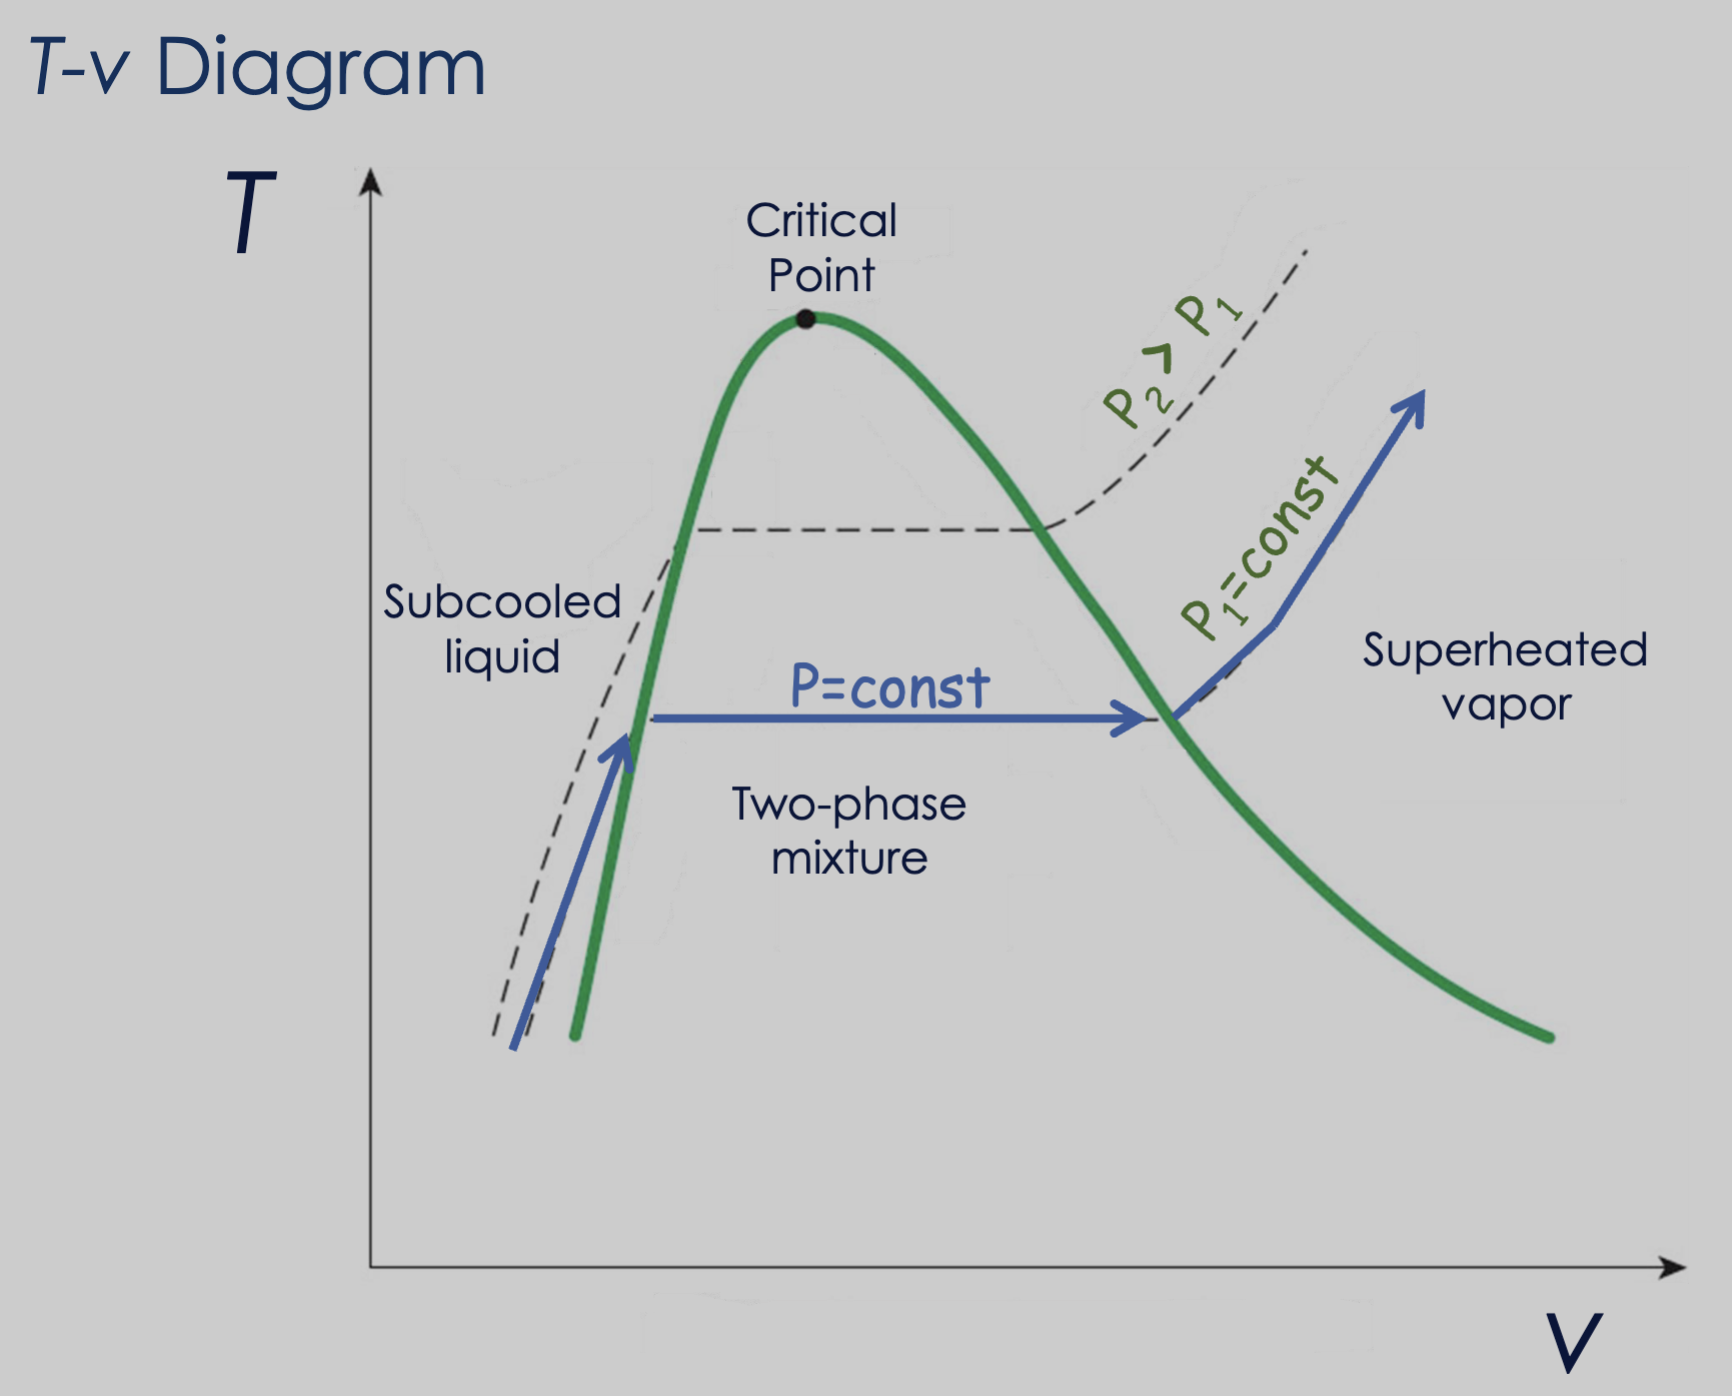
and points on diagram:
P-v Diagram
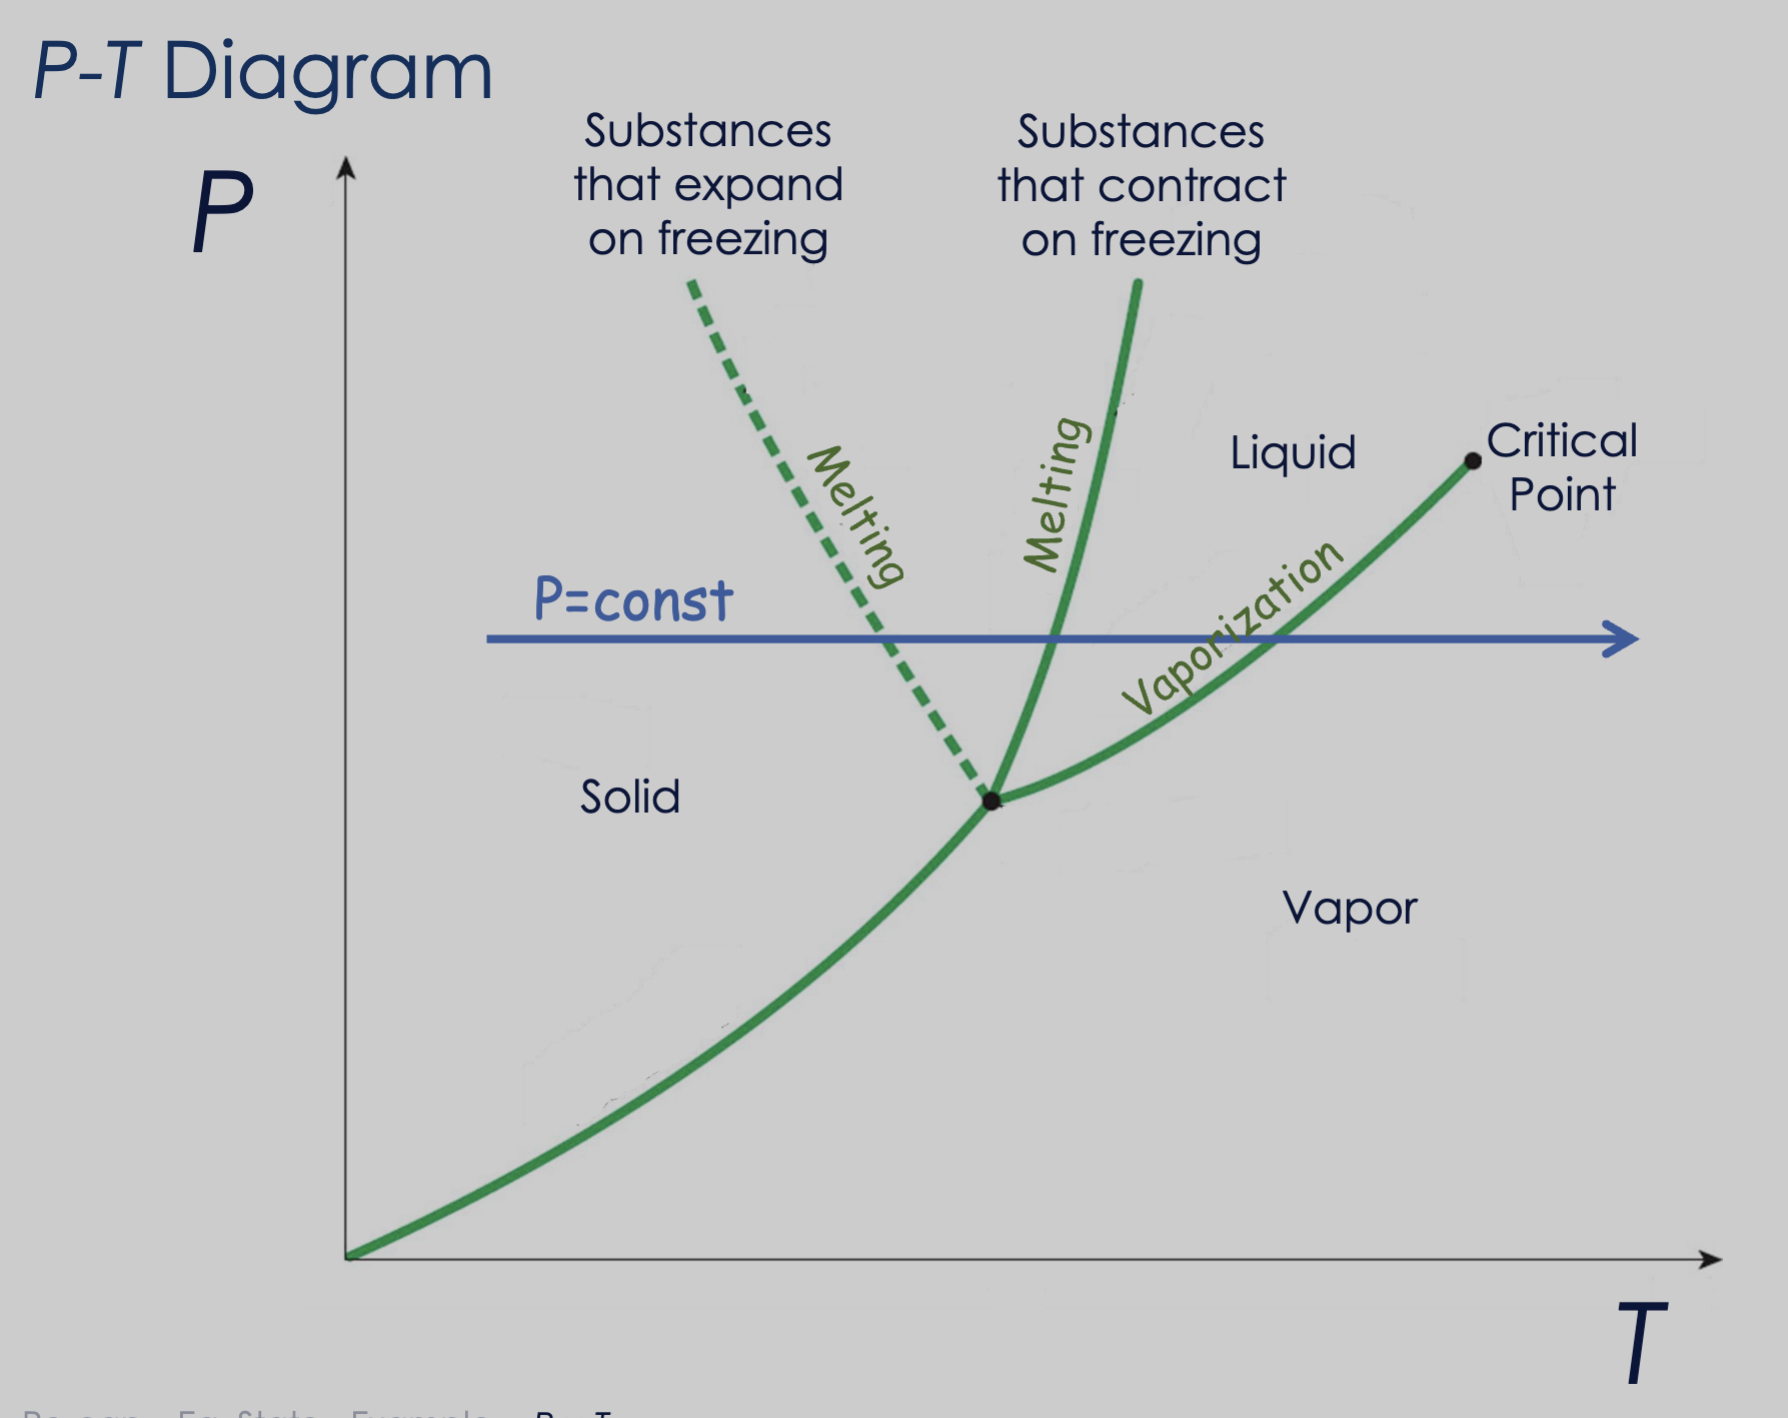
P-T Diagram
P-v-T Surface