First, let us find the properties of the covariance ellipse of a bivariate distribution. The covariance ellipse represents an iso-contour of the Gaussian distribution and allows visualization of a confidence interval in two dimensions. The covariance ellipse provides a geometric interpretation of the covariance matrix.
Any ellipse can be described in four parts:
- Ellipse center
- Half-major axis
- Half-minor axis
- Orientation angle
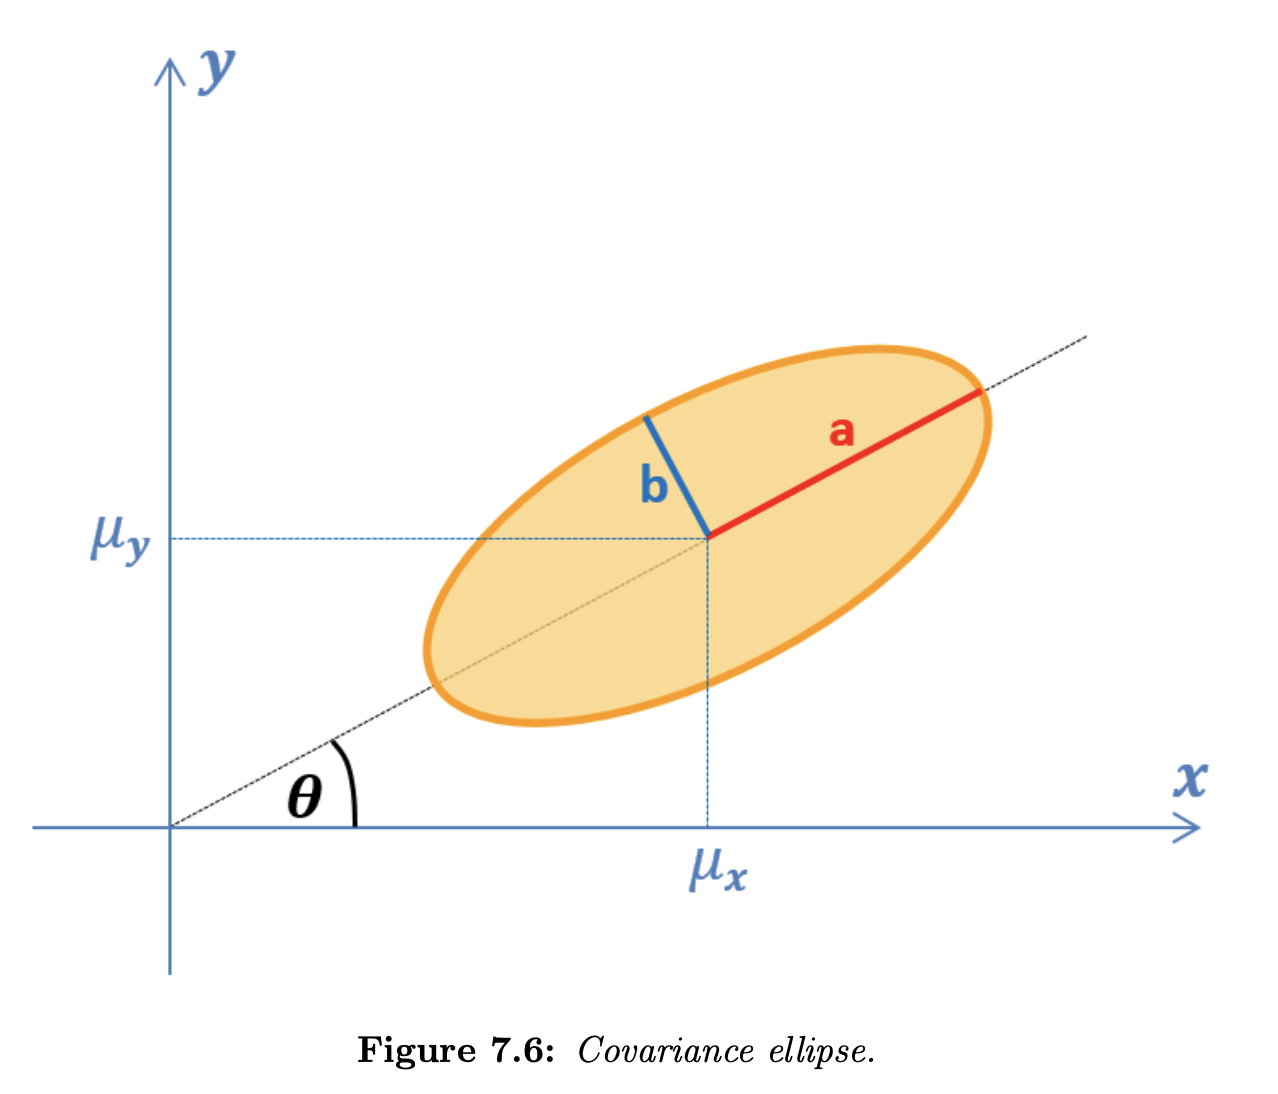
The ellipse center is a mean of the random variable:
The lengths of the ellipse axes are the square roots of the eigenvalues of the random variable covariance matrix:
- The length of the half-major axis is given by the highest eigenvalue square root
- The length of the half-minor axis is given by the second eigenvalue square root
The orientation of the ellipse is an orientation of the covariance matrix eigenvector that corresponds to the highest eigenvalue:
where:
- is the -coordinate of the eigenvector that corresponds to the highest eigenvalue
- is the -coordinate of the eigenvector that corresponds to the highest eigenvalue
Python example:
import numpy as np

C = np.array ([[5 , -2] ,[ -2 , 1]]) # define covariance matrix

eigVal , eigVec = np.linalg.eig(C) # find eigenvalues and eigenvectors
a = np.sqrt (eigVal [0]) # half - major axis length
b = np.sqrt (eigVal [1]) # half - minor axis length

# ellipse orientation angle
theta = np.arctan (eigVec [1 , 0] / eigVec [0 , 0])