1st-order Response
Consider a 1st-order step response with the following transfer function:
with (stable pole). This transfer function has a DC gain (steady-state value) of 1.
We can consider its step response in the time domain:
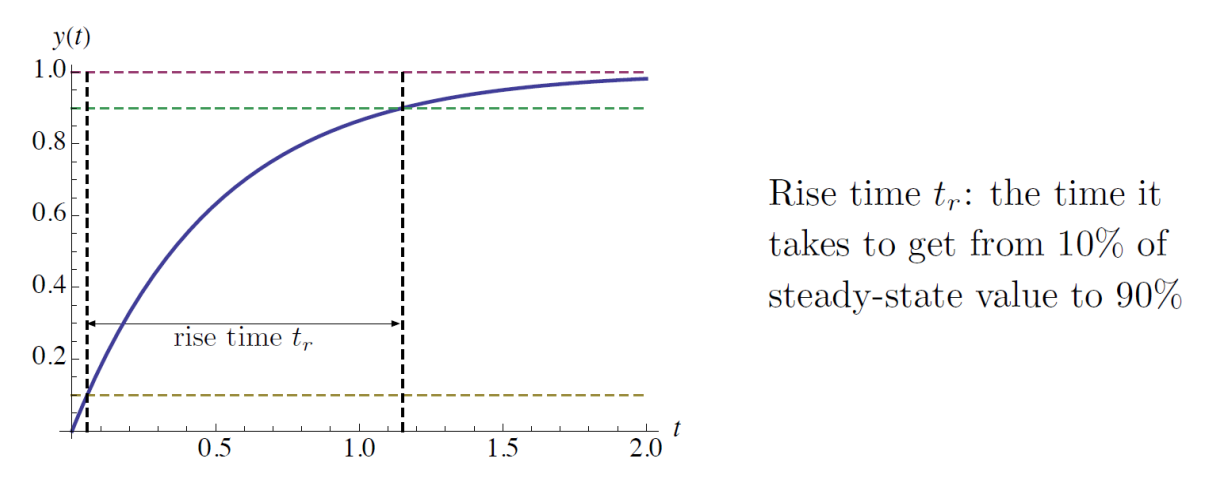
Rise time is defined as the time it takes to get from 10% of the steady-state value to 90%.
In this example, it’s easy to calculate compute analytically:
2nd-order Response
Consider a second-order transfer function given by
where and .
The step response to this is:
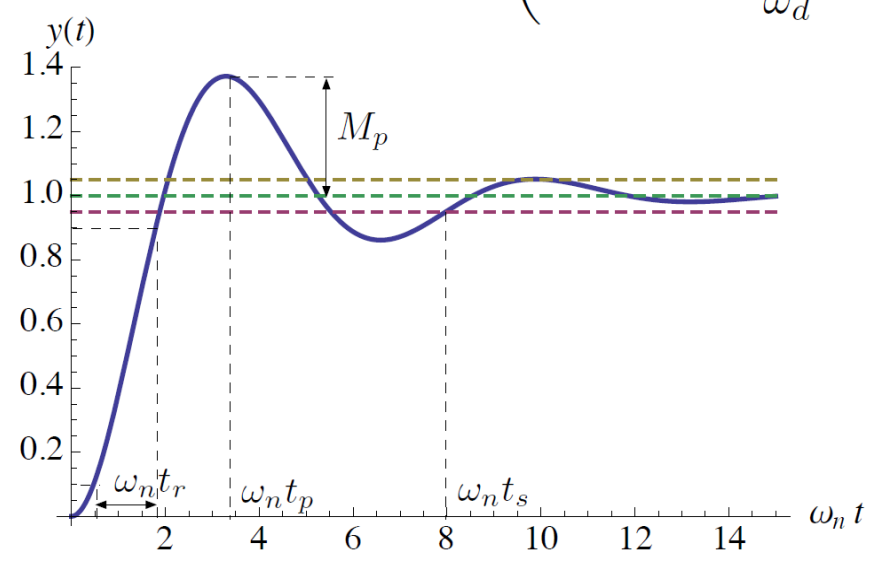
Specs:
- Rise time – time to get from to
- Overshoot – difference between peak magnitude and steady-state value
- Peak time – the time at which the response reaches its maximum peak value after the initial rise
- Settling time – first time for transients to decay to within a specified small percentage of and stay in that range – typically we use 5%.
We typically want all of these quantities to be small, but there can be trade-offs among specs; for example, decreasing rise time may result in an increase in .
Frequency Domain
We want to visualize time-domain specs in terms of admissible pole locations for the 2nd-order system.
Rise time: Suppose we want where is some desired given value, so that
Geometrically, we want the poles to lie in the shaded region:
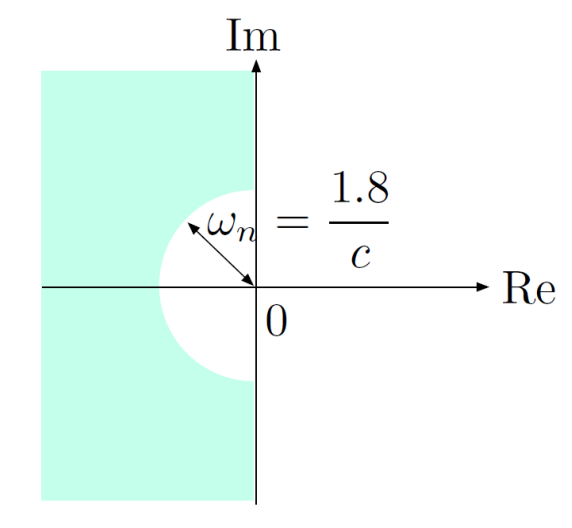
(Recall that is the magnitude of the poles).
Overshoot: Suppose we want , so that
To do this, we need a large damping ratio. Geometrically, we want the poles to lie in the shaded region:

Settling time: Suppose we want , so that
This means we want the poles to be sufficiently fast (large enough magnitude of real part):
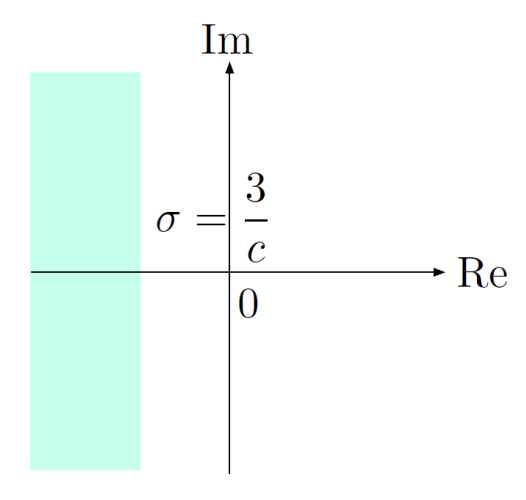
- Intuition: poles far to the left means transients decay faster, leading to lower settling time
Combination: If we have specs for any combination of , we can relate them to allowed pole locations
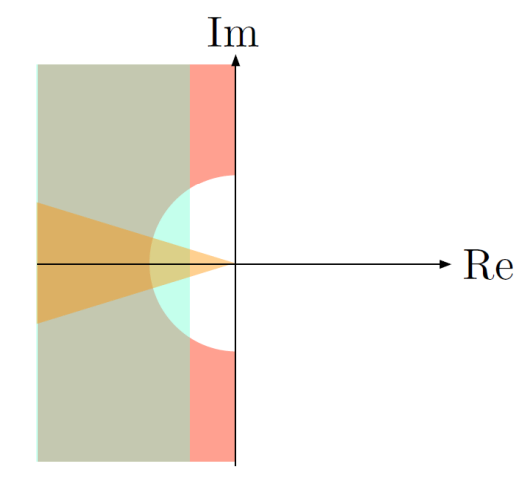
- This is not very rigorous and only valid for our prototype 2nd-order system with 2 poles and no zeros!