We commonly used an idealized S-N diagram for steels, in which the median failure curve is used.
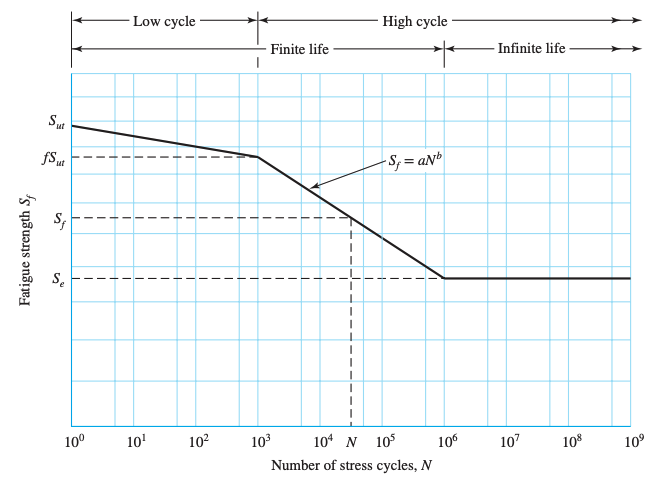
Key points:
- , which is the ultimate yield strength (one cycle)
- In the low cycle region (), the line has a low slope and runs between to some , where .
- Between and cycles, a line of steeper slope represents the failure curve, which is called Basquin’s Equation, .
- After cycles, the endurance limit is reached, and the failure curve becomes horizontal.
Thus, to create an idealized S-N diagram, we generally need to determine at cycles and at cycles.
Estimating the Endurance Limit
For steels, generally we have:
where is the minimum tensile strength.
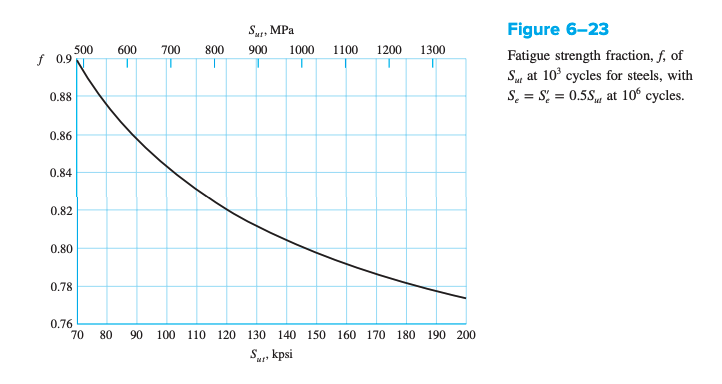
Estimating Fatigue Strength
We want to estimate the fatigue strength at cycles. This can be done with the equations:
In general:
- If is lower than or , use
- If is greater than or , use
Low-Cycle S-N Line
The low cycle line between and cycles is given by Basquin’s equation:
where and .
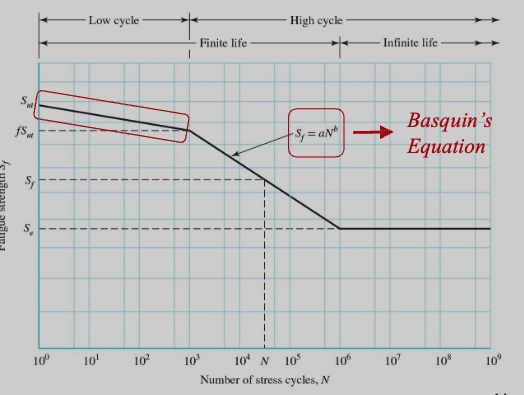
High-Cycle S-N Line
The low cycle line between and cycles is given by Basquin’s equation:
where:
We can use this to solve for :
where is the alternating stress or stress amplitude.