A graph is a very general structure consisting of a set of nodes/vertices, where pairs of nodes are connected by edges/links. Graphs are typically sparse; only a small subset of the possible edges are present.
Examples of graphs
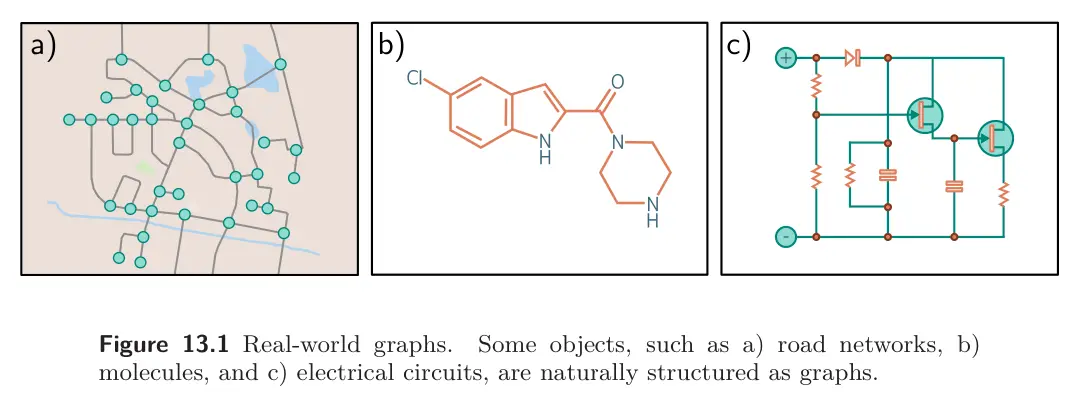
Some objects naturally take the form of graphs:
- Road networks can be considered graphs where nodes are physical locations and edges are roads between them.
- Chemical molecules are small graphs where nodes represent atoms and edges represent chemical bonds.
- Electrical circuits are graphs where nodes represent components and junctions, and the edges are electrical connections.
Many datasets can also be represented by graphs, even if this is not their obvious surface form:
- Social networks: nodes are people, edges are friendships
- Scientific literature: nodes are papers, edges are citations
- Wikipedia: nodes are articles, edges are hyperlinks between articles
- Computer programs: nodes are syntax tokens (variables at different points in the program flow), edges are computations; like Syntax Tree GP Programs?
- Geometric point clouds: each point is a node with edges connecting to nearby points
- Protein interactions in a cell: nodes are proteins, with an edge between two proteins if they interact.
- A set (unordered list) can be treated as a graph in which every member is a node and connects to every other
- An image can be treated as a graph with regular topology, in which each pixel is a node with edges to the adjacent pixels
Types of graphs
Graphs can be categorized in various ways.
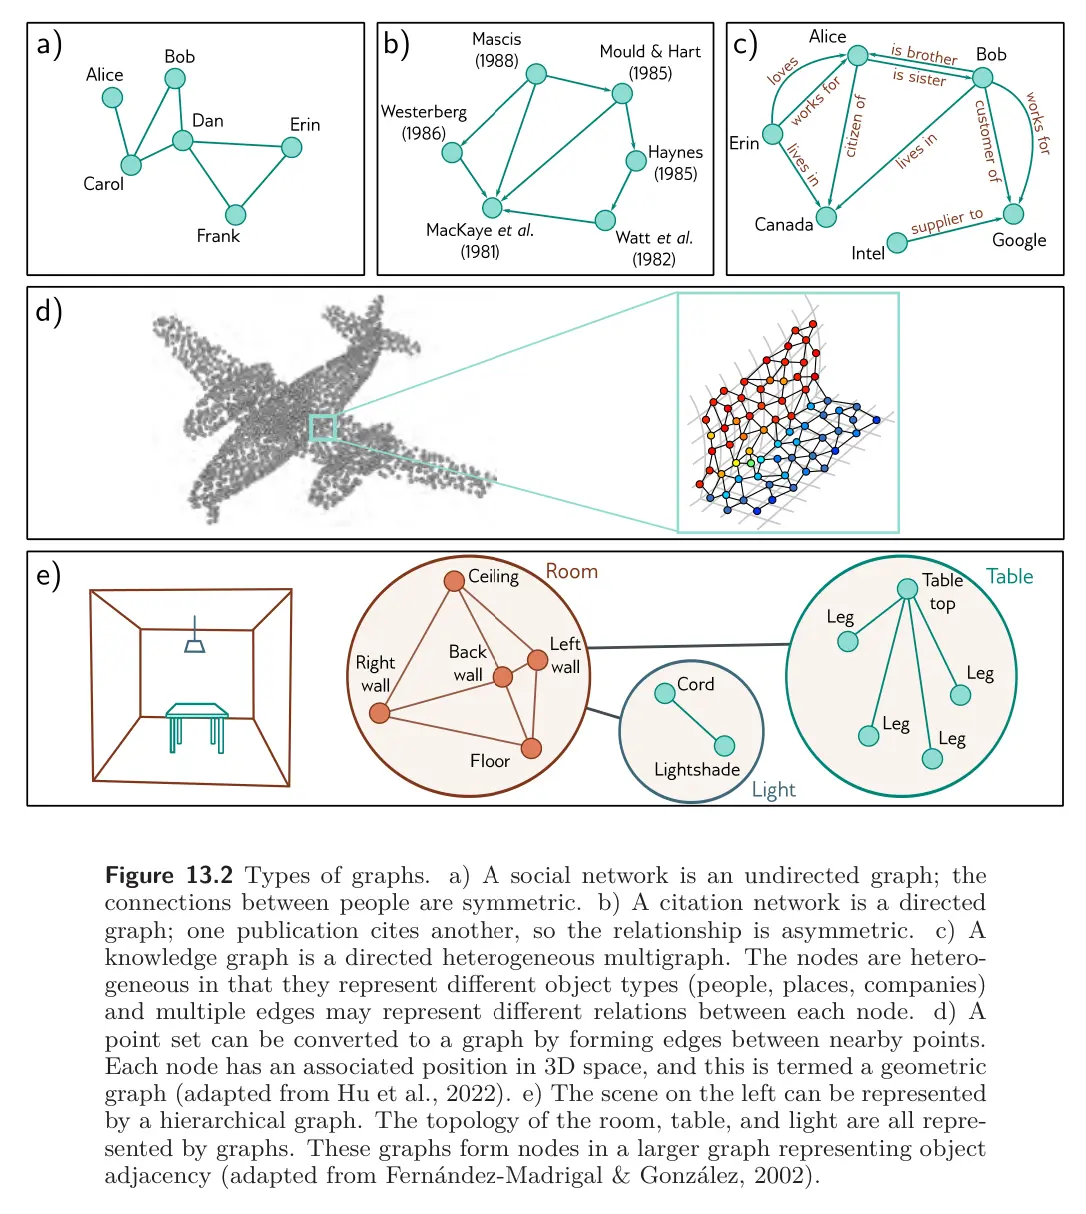
Directed vs. undirected edges: The social network in 13.2a contains undirected edges; each pair of individuals with a connection between them have mutually agreed to be friends, so there is no sense that the relationship is directional. In contrast, the citation network in 13.2b contains directed edges; each paper cites other papers, and this relationship is inherently one-way.
Knowledge graph/directed heterogeneous multigraph: The 13.2c knowledge graph encodes a set of facts about objects by defining relations between them. It is heterogeneous because the nodes can represent different types of entities (people, countries, companies), and it is a multigraph because there can be multiple edges of different types between any two nodes.
Geometric graph: The point set representing the airplane in 13.2d can be converted into a graph by connecting each point to its nearest neighbors. This results in a geometric graph where each point is associated with a position in 3D space.
Hierarchical graph: In 13.2e, the table, light, and room are each described by graphs representing the adjacency of their respective components. These three graphs are themselves nodes in another graph that represents the topology of the objects in a larger model.