Using the RAM Model of Computation, we can count how many steps our algorithm takes on any given input instance by executing it. To understand how good or bad an algorithm is in general, we must know how it works over all possible instances.
For best-case, worst-case, and average-case complexity, think about running an algorithm over all possible instances of data that can be fed to it.
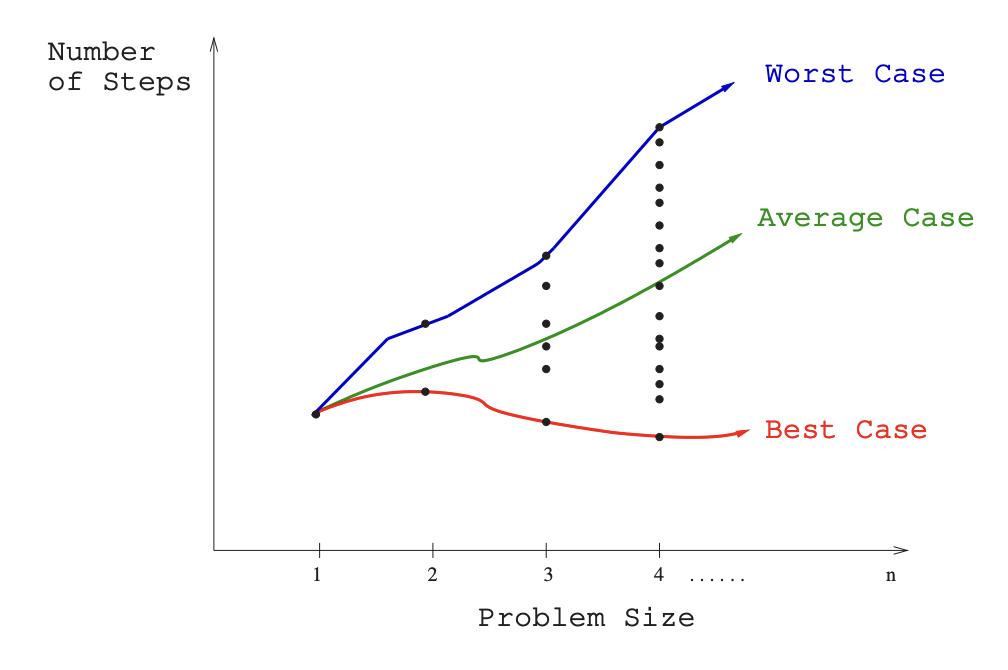
Example: For the problem of sorting, the set of possible input instances includes every possible arrangement of n keys, for all possible values of . We can represent each input instance as a point on a graph (shown in Figure 2.1) where the x-axis represents the size of the input problem (for sorting, the number of items to sort), and the y-axis denotes the number of steps taken by the algorithm in this instance.
To visualize these cases, we can think about every possible arrange for keys:
-
The worst-case complexity of the algorithm is the function defined by the maximum number of steps taken in any instance of size . This represents the curve passing through the highest point in each column. This is usually the most useful.
-
The best-case complexity of the algorithm is the function defined by the minimum number of steps taken in any instance of size . This represents the curve passing through the lowest point of each column. This is useful for randomized algorithms.
-
The average-case complexity or expected time of the algorithm, which is the function defined by the average number of steps over all instances of size .