Bode plots show the frequency response of a transfer function. Consider:
This is the high-pass filter example from Circuit to Transfer Function.
We plot the Bode Magnitude Plot and the Bode Phase Plot .
Bode Magnitude Plot
Here, we substitute back in to sweep frequency.
- At low frequency, (negative dB)
- At high frequency, (0 dB)
- For we know that (-3 dB)
As decreases away from , what happens to ? Imagine we have . This looks like at small frequencies. So, if decreases by , then decreases by (20dB). This tells us the slope of the plot
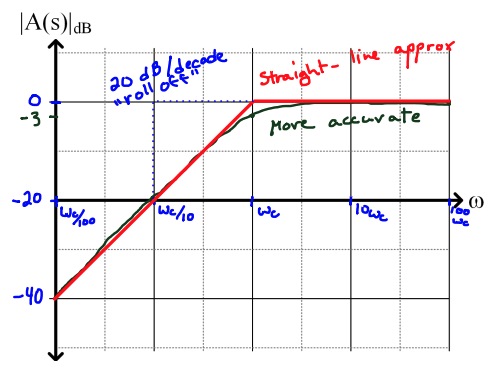
- Red: Bode Straight-Line approximation
- Green: More accurate
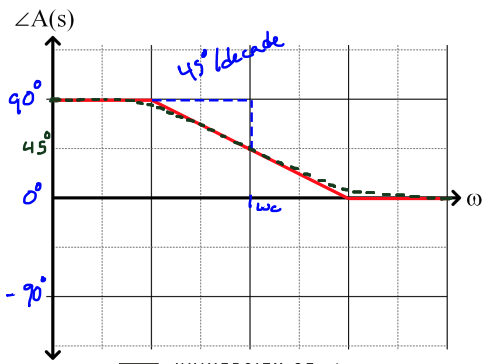
Bode Phase Plot
For , we have:
where N and D are the numerator and denominator. Since has no real component, it is always .
On the other hand:
- at low frequency approaches (value of ),
- at high frequency approaches (value of ),
- at approaches (value of ),