Make a plot of function and observe where it crosses the -axis.
For example, to find the roots of:
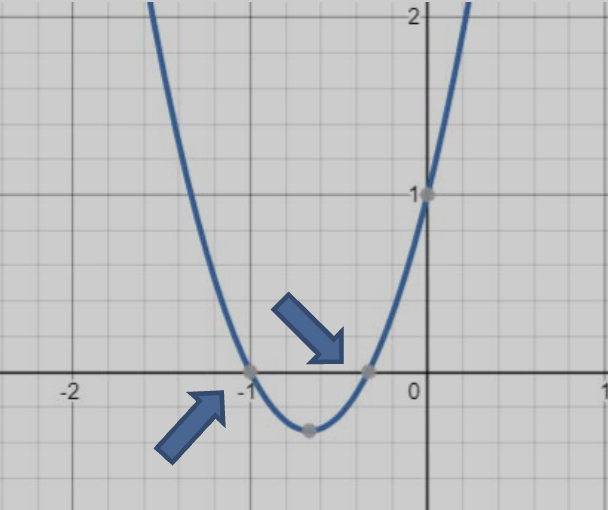
We can first find its minimum at and finding that for this minimum point. We also observe from the graph that it crosses the horizontal axis at .
This basic graphical method is useful for predicting the number of roots and their approximate location, which can serve as a useful starting point for analysis.
Rules of Thumb
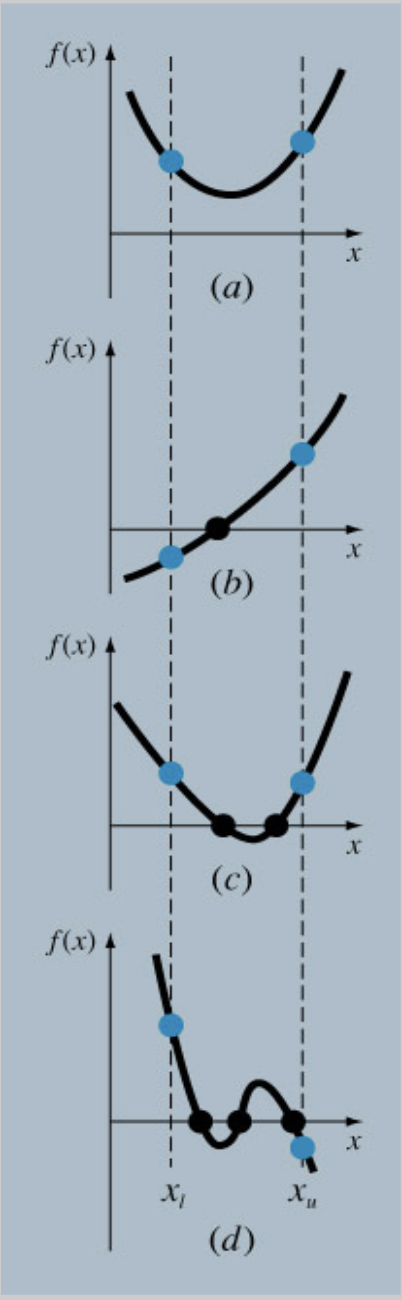
Here are some rules of thumb for root prediction based on graphical methods:
- If and have the same sign, interval has no roots (a) or an even number of roots (c)
- If and have the different signs, there is at least one root (b) or an odd number of roots (d)
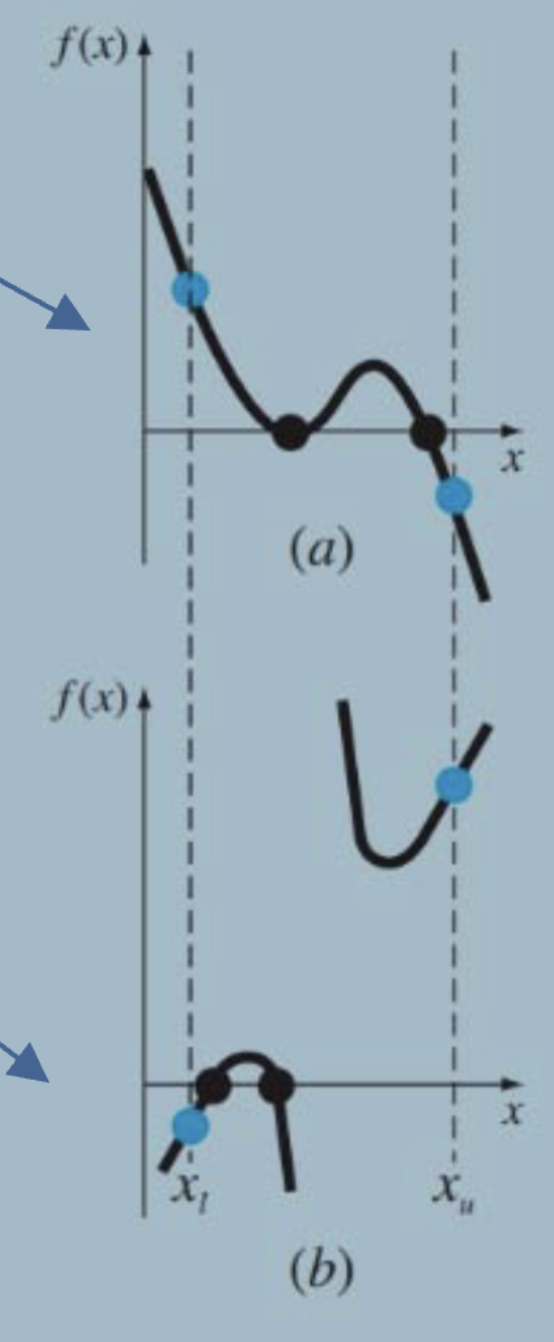
- Exceptions:
- is tangent to the -axis as minimum or maximum
- Function of discontinuous
- Even number of roots in both cases