For two random variables and , the covariance measures the extent to which the two variables vary together. This is defined by:
If and are independent, then their covariance equals zero.
For two vectors and , their covariance is a matrix given by:
If we consider the covariance of the components of a vector with each other, then we use a slightly simpler notation ].
Example
We can consider the covariance to be a measure of the strength of the correlation between two or more sets of random variates.
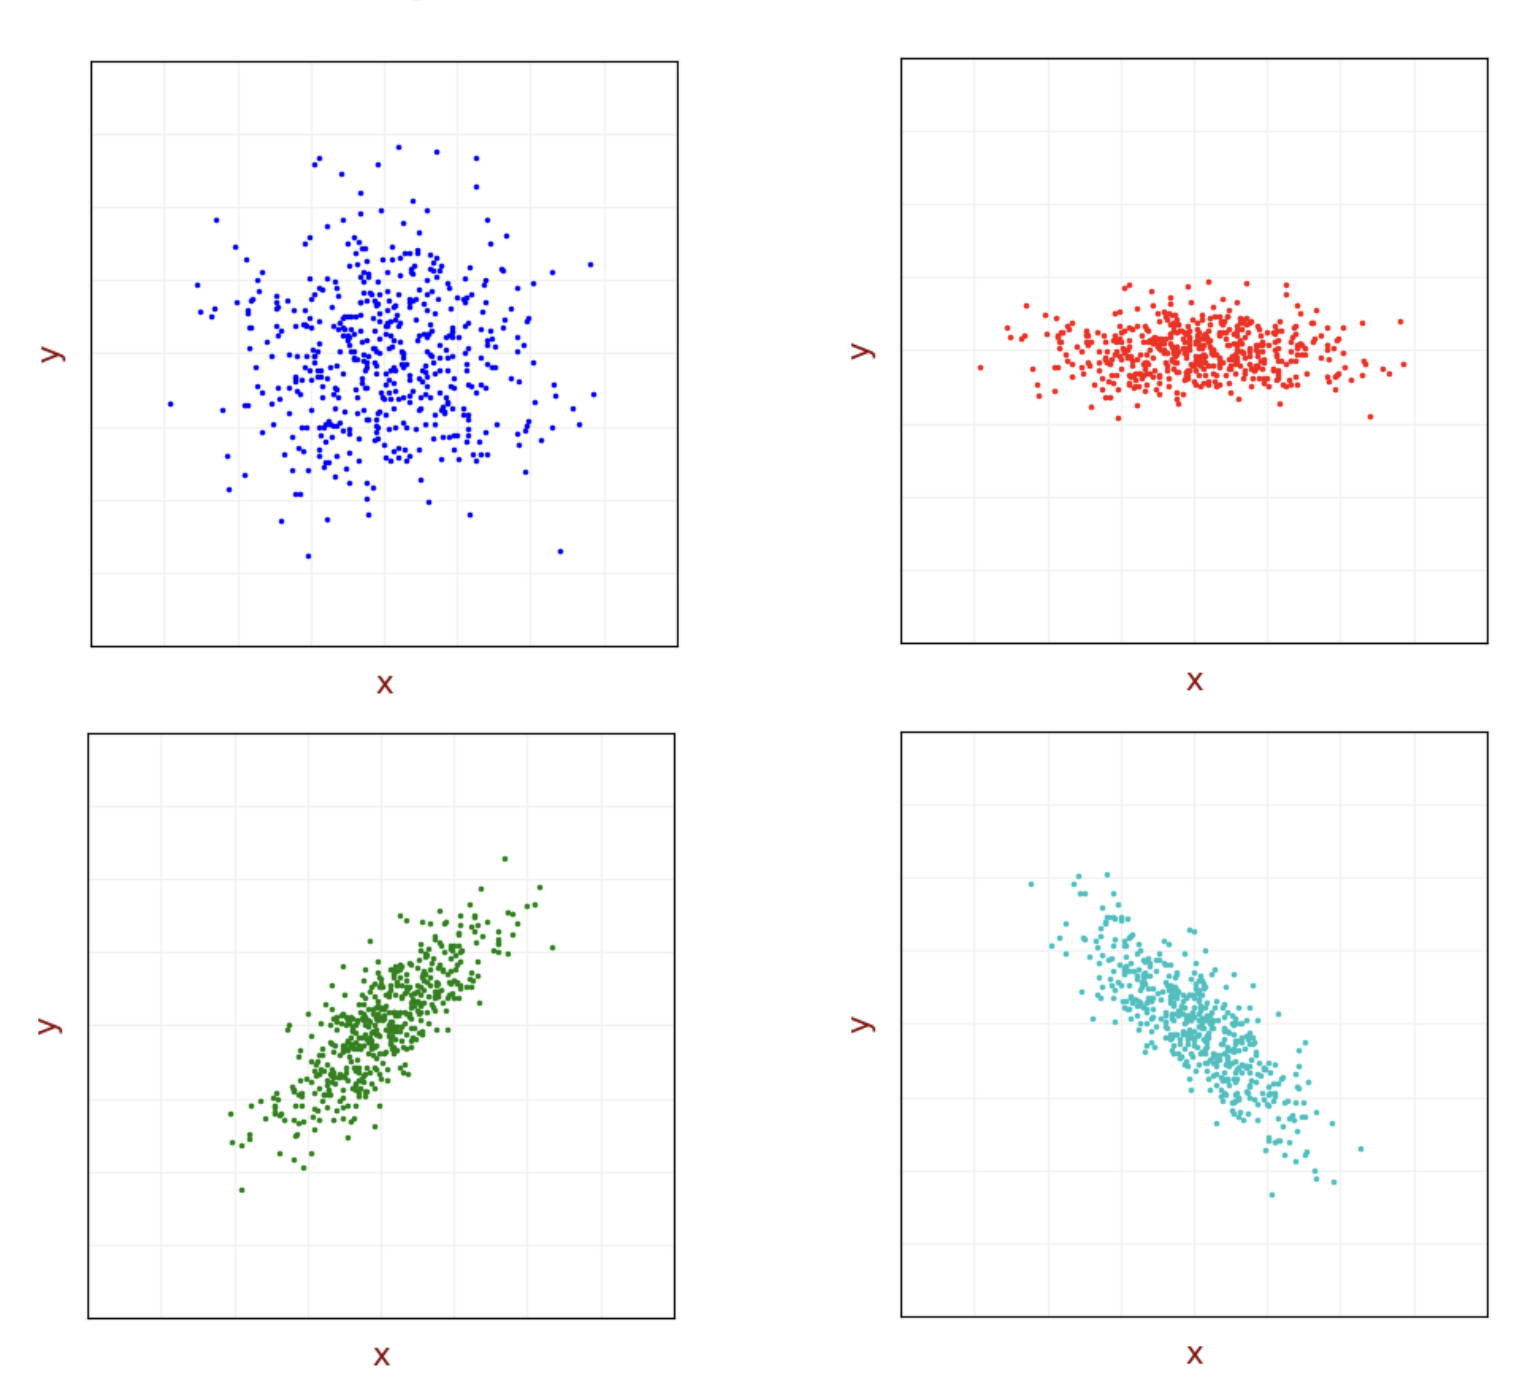
Assume we have a set of location measurements in the - plane. Due to the random error, there is a variance in the measurements. Here are the different measurement sets:

The two upper subplots demonstrate uncorrelated measurements. The and values don’t depend on each other.
- For the blue dataset, the and values have the same variance – circular shape.
- For the red dataset, the values have greater variance than the values – elliptic shape.
- Since the measurements are uncorrelated, the covariance of and equals zero.
The two lower subplots demonstrate correlated measurements. There is a dependency between the and values.
- For the green data set, an increase in results in an increase in and vice versa. The correlation is positive; therefore, the covariance is positive.
- For the cyan data set, an increase in results in a decrease in and vice versa. The correlation is negative; therefore, the covariance is negative.