Since we are isolating for open methods (see here on transforming equations for fixed point iteration), these functions can be thought of as two curves. Using the function used above as an example, we would have:
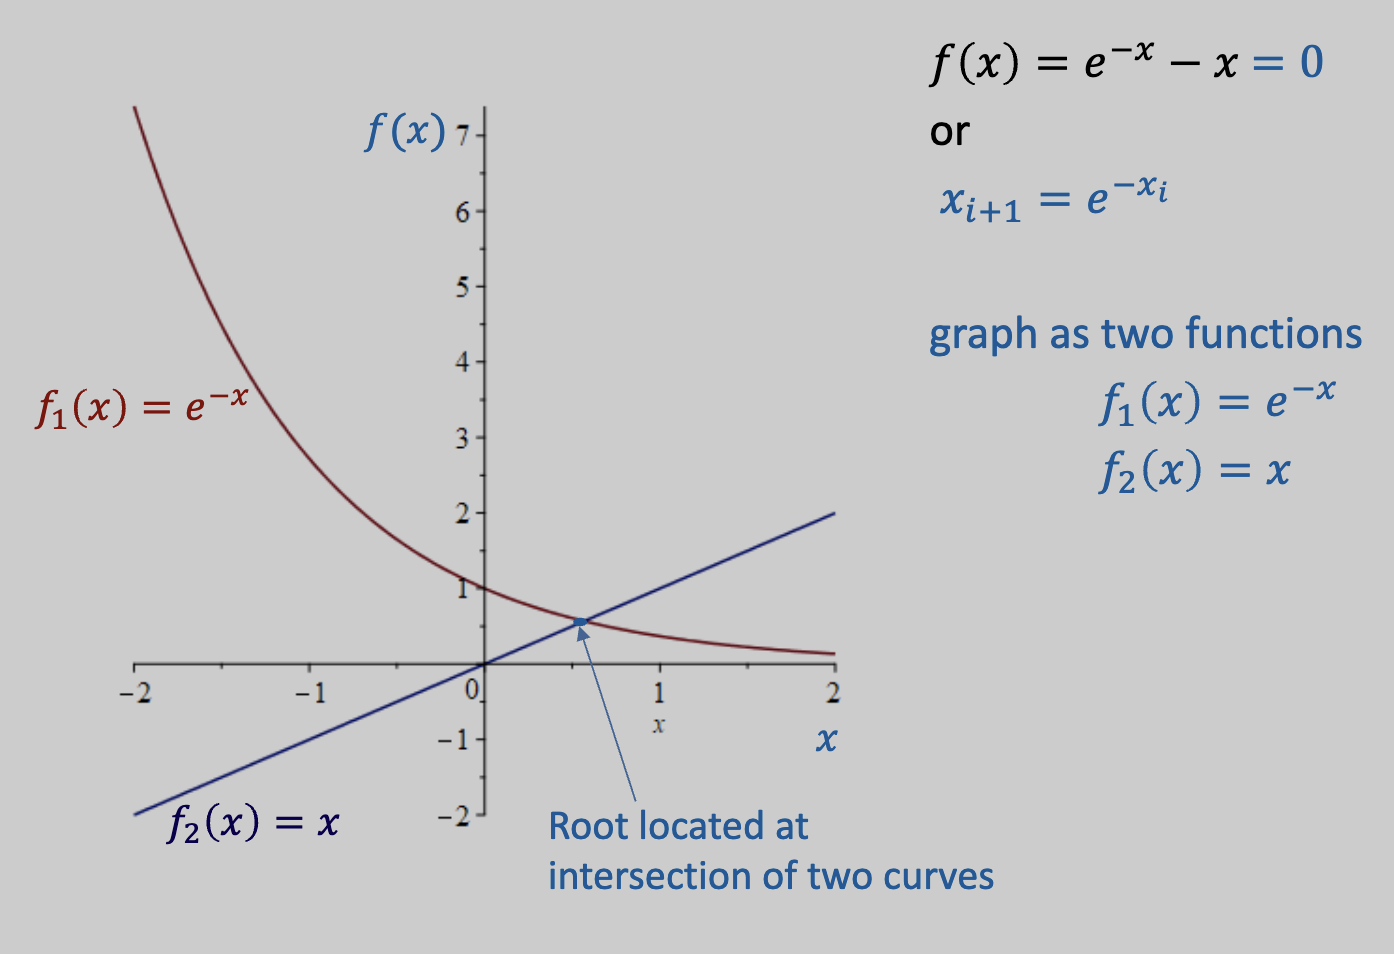
Since we are isolating for open methods (see here on transforming equations for fixed point iteration), these functions can be thought of as two curves. Using the function used above as an example, we would have: