To find the required return on an investment, we need to know the risk premium of the investment, then add the risk free rate to it. Steps:
- Measure the investment’s systematic risk – this lets us determine how much of the variability of its return due to systematic risk vs. unsystematic risk.
- Determine the risk premium required to compensate for that amount of systematic risk.
Market Portfolio
To determine the systematic risk, we a benchmark portfolio – a market portfolio.
Suppose all investors wants to hold portfolios that are fully diversified and optimal. If everyone is expected to hold the most diversified portfolio, everyone must hold the same portfolio with same composition. Because every security is owned by someone, the sum of all investors’ portfolios must equal the portfolio of all risky securities available in the market. As such, the investment in each security is proportional to its market capitalization, which is the total market value of its outstanding shares. The market portfolio consists of all risky investments that are trading in the market and is held in proportion to their market value. The market portfolio is value-weighted, and consists of only systematic risk.
In reality, we use a market proxy – a portfolio whose return should track the underlying, unobservable market portfolio. Most common proxy portfolios are:
- Market indexes, like the Dow Jones Industrial Average, the S&P 500
- Index funds
- Exchange Traded Funds (ETF)
Measuring Systematic Risk
To determine how much of a stock’s return variability is due to systematic risk, we can measure the average change in its return for each 1% change in the return of a portfolio that fluctuates solely due to systematic risk (the market portfolio). Any risk that is correlated with the market portfolio must be systematic risk.
Beta
Beta () is the is the expected percentage change in the return of a security for a 1% change in the market’s return:
where is security ‘s return and is market return.
- Note that market (well-diversified) portfolio has a beta of 1.
Cases:
- the asset has same systematic risk as the overall market
- the asset has less systematic risk than the overall market
- the asset has more systematic risk than the overall market
- the asset has no systematic risk
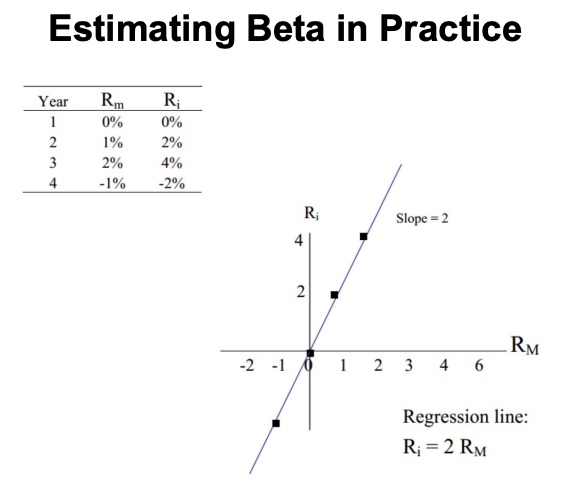
Estimating in practice:
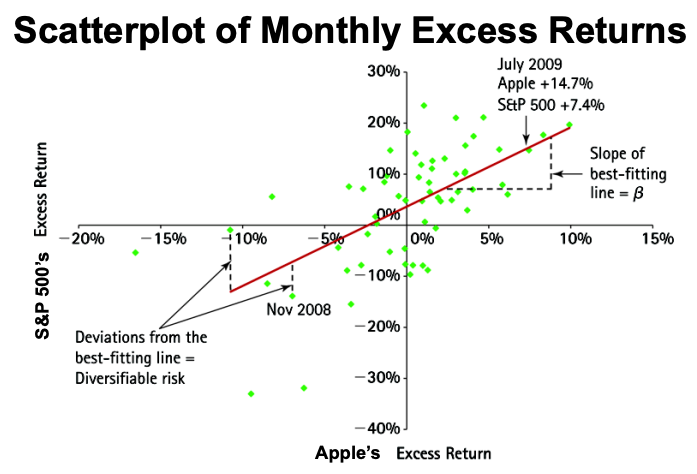
- Use linear regression to estimate the relation between a stock’s returns and the market’s return.
- Typically, these data sources estimate correlations and volatilities from two to five years of weekly or monthly returns and use the S&P 500 as the market portfolio.
- The best-fitting line represents the historical relation between the stock and the market.
- Slope of this line is our estimate of its beta.
- Returns of the market portfolio is the single explanatory factor for returns of the stock.
Example

- Total risk is measured by standard deviation – Starbucks is higher.
- Systematic risk is measured by beta – Target is higher.
- Risk premium is directly related to systematic risk (beta) – Target is higher.