CAPM is a way to calculate the expected return. In general, we have
The risk premium depends on two things:
- Beta – the measure of amount of systematic risk
- Market risk premium , which is the risk premium for a portfolio with a beta of .
Thus:
Market Risk Premium
The term above is called the market risk premium, also written as .
This is the additional return over the risk-free rate needed to compensate investors for taking an average amount of risk. It is the risk premium on a market portfolio.
The size of market risk premium depends on the perceived risk of the stock market and investor’s degree of aversion. If investors think that the stock market is overall risky, the market risk premium will rise.
In general, is the risk premium for a risky asset with beta .
Example
Suppose the risk-free return is 3% and you measure the market risk premium to be 6%. Apple has a beta of 1.6 According to the CAPM, what is its expected return?
- Because of Apple’s beta of 1.6, investors will require a risk premium of 9.6% over the risk-free rate for investments in its stock to compensate for the systematic risk of Apple stock.
- With a risk free rate of 3%, this leads to a total expected return of 12.6%.
- Because investors will not invest in Apple unless they can expect at least 12.6%, we also call this return the investment’s required return.
Notes:
- Apple’s beta is 1.6, its return is more volatile than the market return. If market return increases by 1%, Apple’s expected return will increase by 1.6%.
- Currently the market risk premium = 6%
- If the market return Rm increases by 1%, , Apple’s expected return will be:
- i.e., Apple’s expected return will increase by 14.2% - 12.6% = 1.6%, it is 1.6 times of the increase in market return
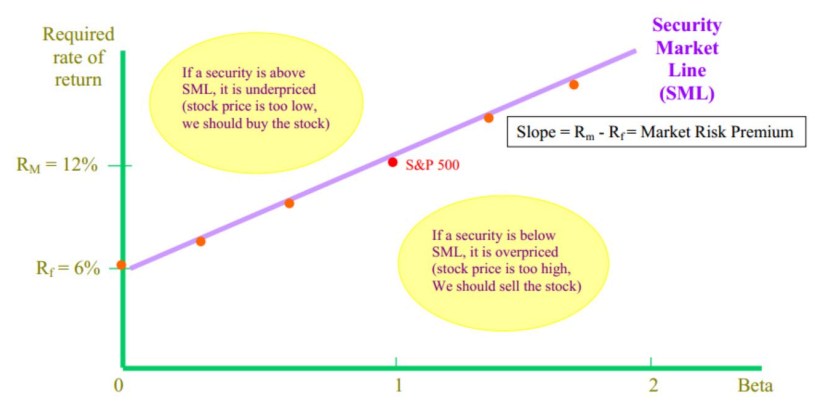
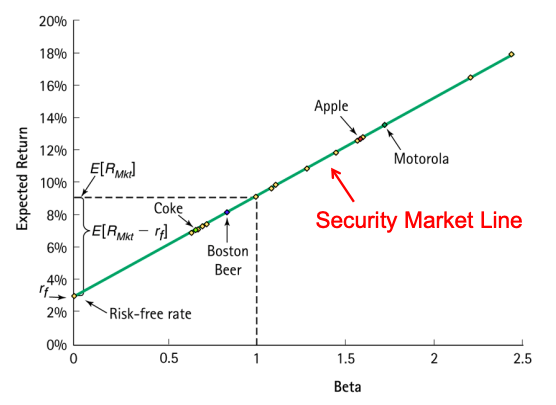
Security Market Line
Recall from Chapter 11 that there is no clear relation between a stock’s standard deviation (total risk) and its expected return. However, the CAPM equation implies that there is a linear relation between a stock’s beta and its expected return. This line is graphed through the risk-free investment (with a beta of zero) and the market (with a beta of one); it is called the security market line (SML).
We see that the relation between risk and return for individual securities is only evident when we measure market risk, rather than total risk.
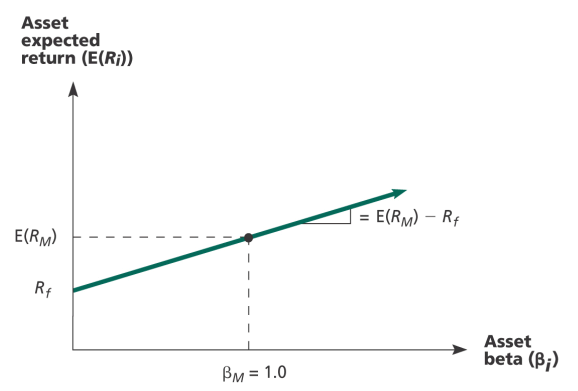
The slope for this is is given by
Since the beta for the market is ALWAYS equal to 1, the slope can be rewritten as .
Theoretically, every security should lie on the SML
- Above SML → Underpriced (should buy the stock)
- Below SML → Overpriced (should sell the stock)